


Quick answer
A 13-week cash flow forecast is a week-by-week view of the cash you expect to come in and go out over the next quarter. Start from today’s bank balance, add the cash you expect each week, subtract what has to go out, and watch for any week that drops below the minimum you need. Update it every week.
What a 13-week cash flow forecast is
A week-by-week view of cash in and cash out for the next quarter, so you see a shortfall before it happens.
Each column is a week. Each row is a source of cash coming in or a reason cash goes out. At the bottom of every week you get two numbers: the net cash for that week, and the cash you expect to have in the bank at the end of it.
It is not a budget and it is not a profit and loss statement. A budget says what you plan to spend over a year. A profit and loss statement says whether you made money. A cash flow forecast says whether the money will be in the account on the day you need it. Those are three different questions, and owners get caught when they only look at the first two.
Why 13 weeks
Long enough to see a problem coming, short enough to stay accurate.
A month is too short.
By the time you see the gap, payroll is already due.
A year is too long.
The numbers turn into guesses, and nobody updates a guess.
Thirteen weeks is one quarter.
It shows every payroll cycle, the rent, the big vendor payments and the customer receipts in one view.
It works week by week.
Cash problems happen on specific days, not in monthly averages.
Thirteen weeks gives you enough runway to act. If week nine looks tight, you have two months to collect sooner, move a payment, or cut a cost. If you only see it in week eight, you have days.
How to build it, step by step
Six steps in a spreadsheet. The first version takes an hour or two.
Start with the cash you have today.
The real bank balance across your operating accounts, not what the books say you should have.
List the cash coming in, week by week.
Customer payments on the week you expect them to land, not the week you send the invoice. Add any other income: deposits, refunds, a loan draw.
List the cash going out, week by week.
Payroll on its actual pay dates. Rent on its due date. Vendors, software, taxes and loan payments on the weeks they leave the account.
Calculate net cash for each week.
Cash in minus cash out. A negative week isn’t a problem on its own; the running balance is what matters.
Calculate ending cash for each week.
Last week’s ending cash plus this week’s net. Week one starts from today’s balance.
Set a minimum and flag anything under it.
The lowest balance you’re comfortable with, for example one payroll plus rent. Highlight every week that drops below it.
You don’t need special software. A spreadsheet with weeks across the top and categories down the side does the job. If you’d rather not build it from scratch, the free 13-week cash flow template already has the rows, the formulas and the warning set up.
The 13-week cash flow template
The forecast from this guide, ready to fill in. Works in Excel and Google Sheets.
- Thirteen weeks on one page: cash in, cash out, net and ending cash for each week.
- A built-in warning: any week below your minimum cash turns red.
- A how-to tab and a filled example so you can see how it reads.
Here's your 13-week cash flow template.
We also emailed you a copy, and you’ll get our monthly operator note. Unsubscribe any time.
That didn't go through. Please try again, or email hello@lockhold.com.
A worked example
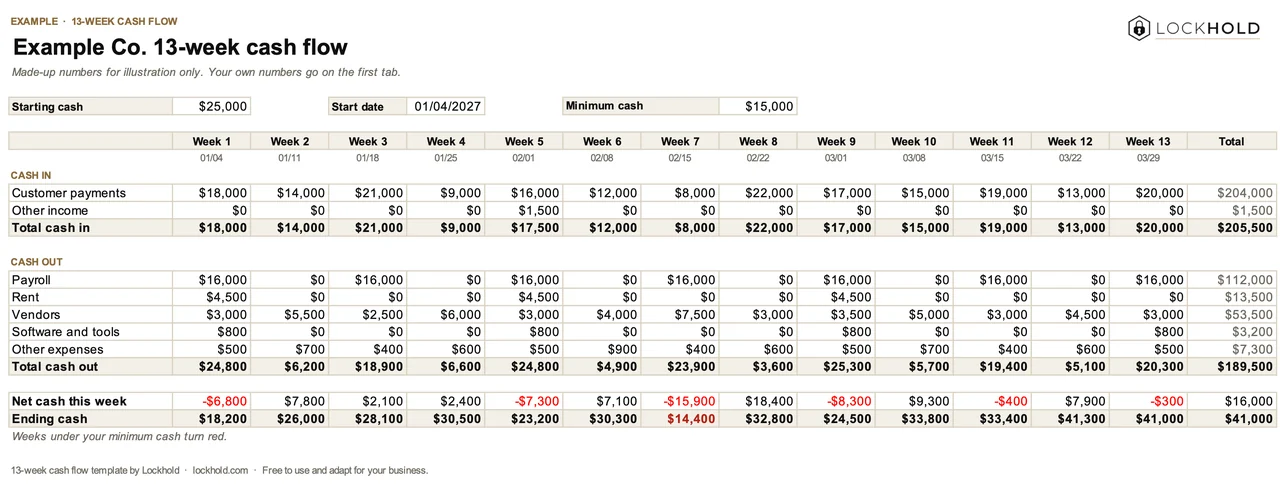
A service business with $25,000 in the bank, a $15,000 minimum, and payroll every other week.
The numbers below are made up to show how the forecast reads. The pattern is common: most weeks are fine, but one week stacks a payroll, a large vendor bill and a slow week of customer payments on top of each other.
Nothing about week seven shows up in a monthly view. The month looks healthy. Week by week, there’s a few days where the account dips under the line you set. Seeing that in week one gives you options: ask two customers to pay a week early, move the vendor payment by a few days, or hold a purchase until week eight.
What to watch
The forecast is only as good as its timing. These are the places timing goes wrong.
Weeks where ending cash drops.
Look at the trend, not just the weeks under the minimum.
Large one-time payments.
Annual insurance, a tax payment, equipment. They hide easily and hit hard.
Customers who pay late.
Put their payments on the week they usually pay, not the due date.
The gap between paying and getting paid.
If you pay suppliers in 15 days and customers pay you in 45, growth uses up cash before it brings any in.
Growth deserves its own warning. More sales usually means more payroll, more inventory and more vendor spend before the customer money arrives. A business can be growing, profitable and short on cash at the same time. The forecast is how you see that coming.
Keep it current: the weekly habit
Same day every week: replace last week’s guesses with what happened, then add a new week at the end.
Update the actuals.
Swap last week’s forecast numbers for what actually came in and went out.
Roll it forward.
Drop the week that just ended and add week 13, so you always see a full quarter ahead.
Check the flagged weeks.
For each week under the minimum, decide what you’ll do and who owns it.
Bring it to the weekly meeting.
Cash belongs next to the other numbers on your weekly KPI dashboard, reviewed as part of the weekly operating rhythm.
The first forecast is the hardest. After a few weeks the update takes fifteen minutes, and the payoff is that cash stops being a surprise. If nobody owns the update, it stops after a month. Give it an owner, the same as any other number in the business.
How to Build a 13-Week Cash Flow Forecast
See a cash problem coming a quarter ahead. One page, ready to print or share with your team.
Your guide is ready.
We also emailed you a link to your library, so you can come back to it from any device.
That didn't go through. Please try again, or email hello@lockhold.com.
FAQ
What is the difference between a cash flow forecast and a budget?
A budget plans what you expect to earn and spend over a year. A cash flow forecast tracks when cash actually moves in and out of the bank, week by week. A business can be on budget and still run short of cash on a given week.
How accurate does a 13-week forecast need to be?
Accurate enough to make decisions. The first few weeks should be close; the later weeks are estimates that get better as you update them. The weekly update is what makes it reliable over time.
Should I use cash flow software instead of a spreadsheet?
Start with a spreadsheet. It forces you to understand where the cash goes. Once the weekly habit sticks, software that pulls from your bank and accounting tools can save time on the updates.
Who should own the cash flow forecast?
Whoever runs the money day to day: a bookkeeper, controller, operations lead or the owner. One person updates it every week, and the owner reviews it in the weekly meeting.
Want it built and running?
A forecast you update every week means cash stops being a surprise, and the decisions about it get made early, when you still have options.
If you want the forecast set up, owned and reviewed every week without it landing on you, that’s part of what a fractional COO does. If it’s one system that needs building, see operations consulting.
Related guides and work
How to build a KPI dashboard
The numbers to track, sales first, and how to build a dashboard your team checks every week.
Read the guide GuideWhat does a COO do?
What the role owns day to day, and when a growing business needs one.
Read the guide ServiceFractional COO
The COO work, without the full-time hire: systems, reporting and handoffs built and handed over.
Read →